Content:
They are (spectral lines and spectral bands) NOT THE SAME THING!!!
Spectral lines or bands?
Spectral line refers to a single electronic transition between two energy levels. Appears as a sharp line, specifically as a delta funtion.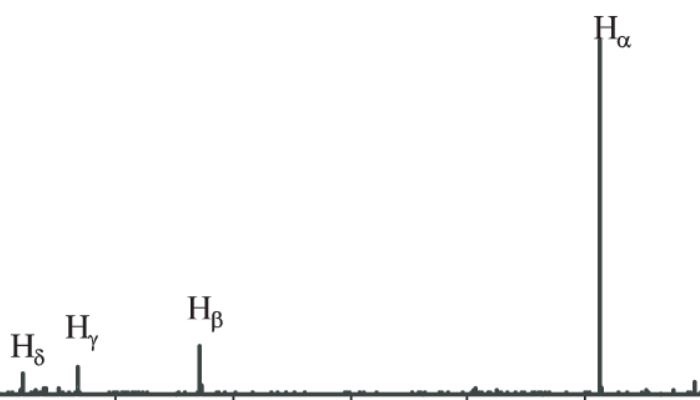 H Balmer lines is an example. It is one of a set of series describing the spectral line emissions of the hydrogen atom. Balmer series, remember? Single electronic transition hc/λ × 1/En - 1/Em or something like that.
Just to mention briefly, spectral lines refer to transitions occuring only between electronic states Eelectronic. Not vibronic or rotational.
H Balmer lines is an example. It is one of a set of series describing the spectral line emissions of the hydrogen atom. Balmer series, remember? Single electronic transition hc/λ × 1/En - 1/Em or something like that.
Just to mention briefly, spectral lines refer to transitions occuring only between electronic states Eelectronic. Not vibronic or rotational.
Spectral bands refer to... I didn't understand actually.
Okay, what is fine structure?
Fine structure refers to small splittings of energy levels caused by additional interactions beyond the basic electronic energy. It occurs due to spin-orbit coupling. It leads to spectral bands. HOW?
Come back to deeply grasp spectral bands and fine structure...
Width of spectral lines and bands
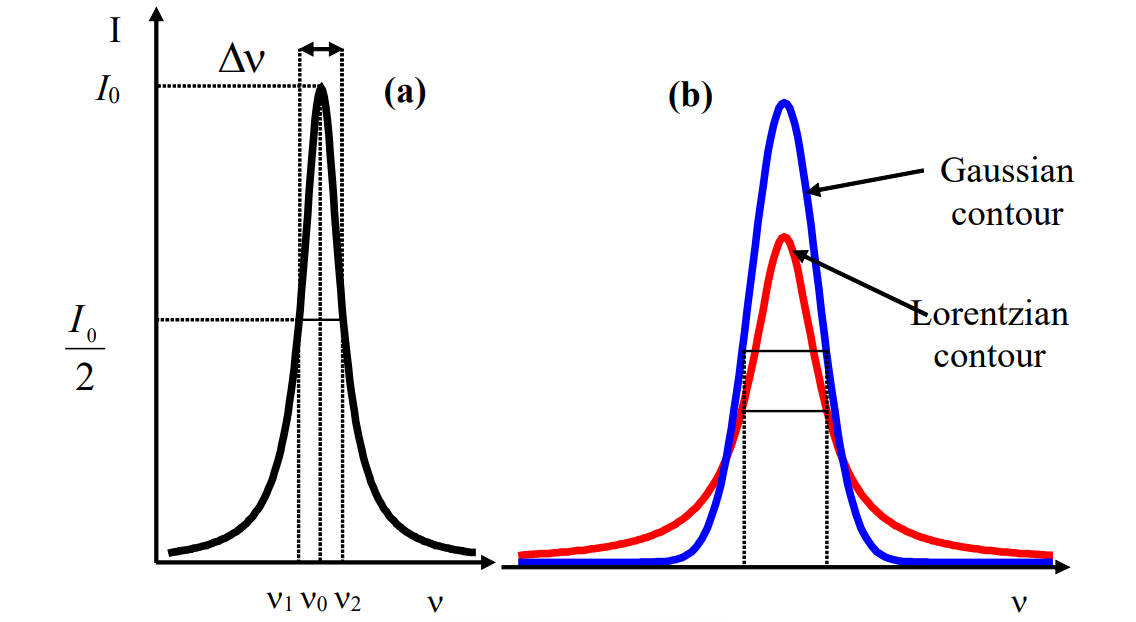
We can observe widths of spectral lines and bands (for spectral lines delta function is ideal case) and there's an physical interpretation in this.Imax / 2
Here's a rotational spectrum (due to transitions between rotational energy levels of a molecule):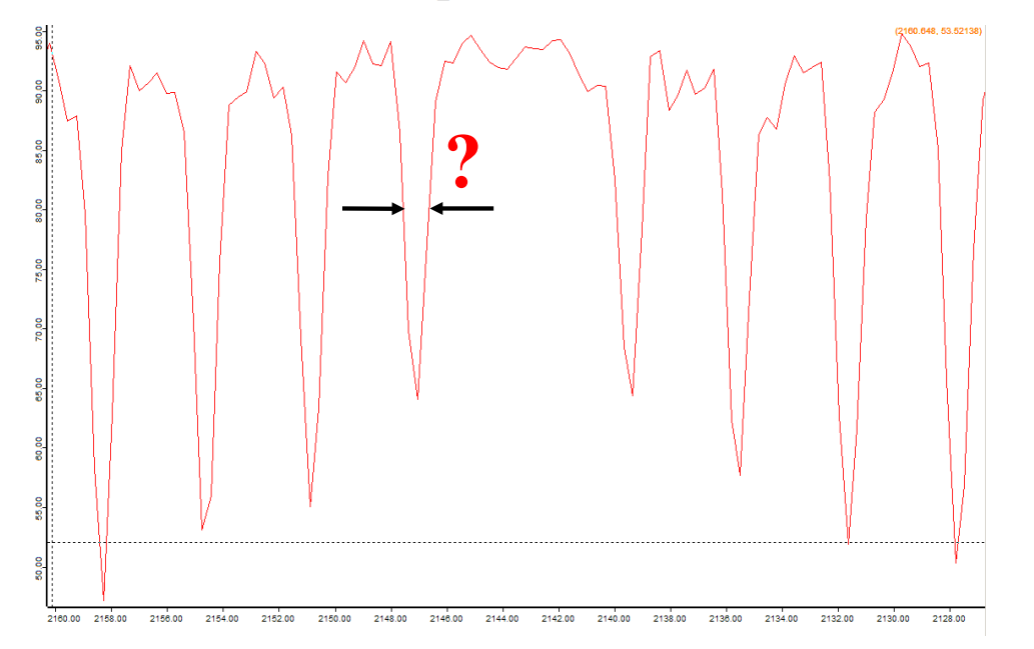
SPECTRAL BROADENING
Natural broadening
It is a linewidth occurs due to finite time of existence of excited state.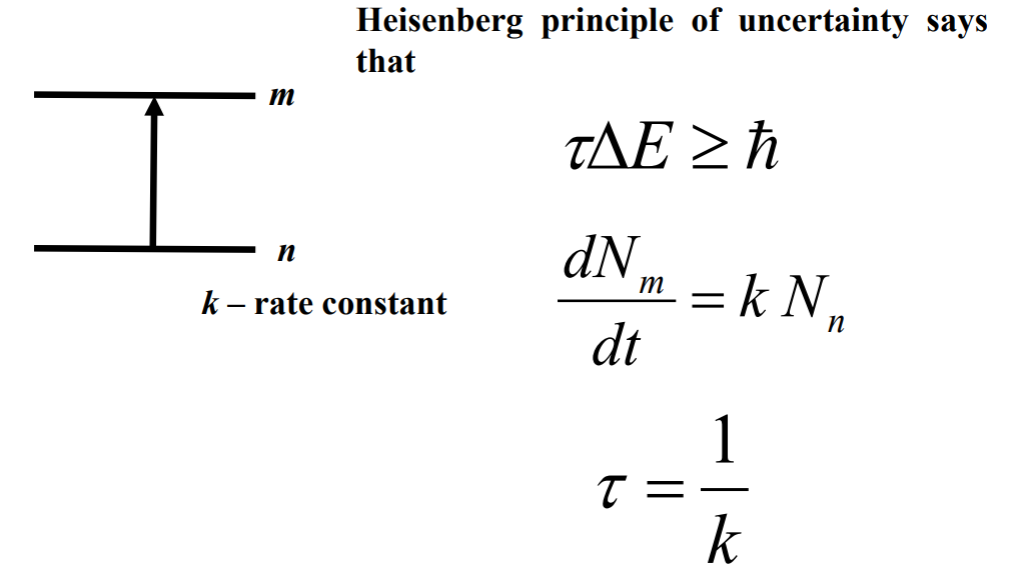 The excited states lasts for τ time, which we obtained via fourier transformation apperantely.
 We started with this Einstein coefficients and for
 n->m, we concluded:
 This rate equation which has a solution:
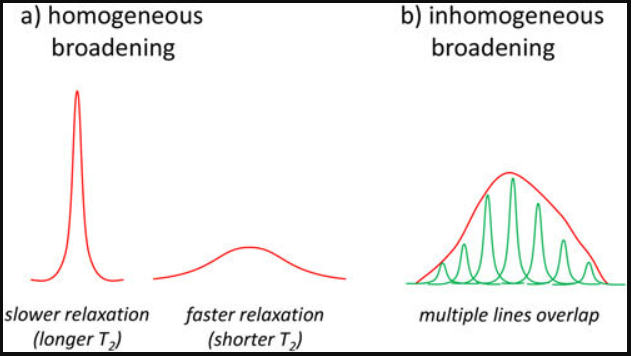
 This type of broadening is called homogeneous broadening and it gives Lorentzian lineshape.
QUESTION!!! What exactly makes this called homogenous broadening?
A distinction of homogeneous and inhomogenous broadening is that in homogeneous broadening, every atom/molecule has the same lineshape and same center frequency. In inhomogenous broadening different atoms/molecules has different resonance frequencies. This is important. Distinguish Lorentzian and Gaussian lineshapes well.
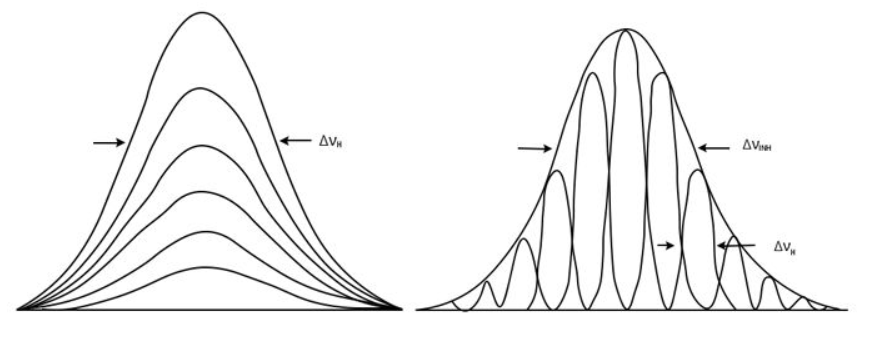
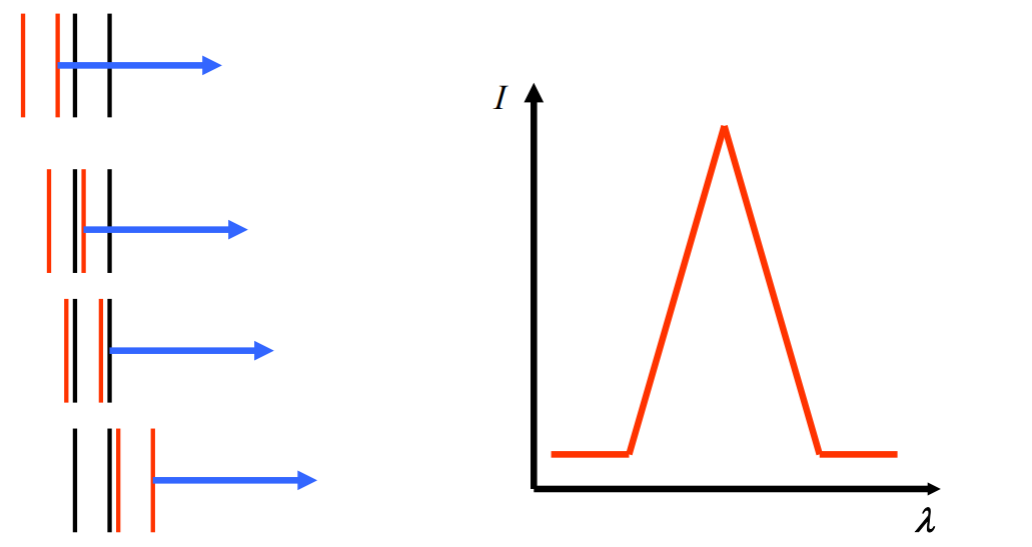
Moving on with Doppler broadening. It gives Gaussian contour. Frequency and absorbed and emitted radiation depends on magnitude and direction of velocity vector of detector in respect to light source.
We also have collusional broadening. COME BACK HERE!!!!
 IMPORTANT!!!! Spectral broadening is really important. Understand the cause. Understand how to use Einstein coefficients to illustrate it. Understand distinction of homogenous and inhomogenous broadening. Clasify
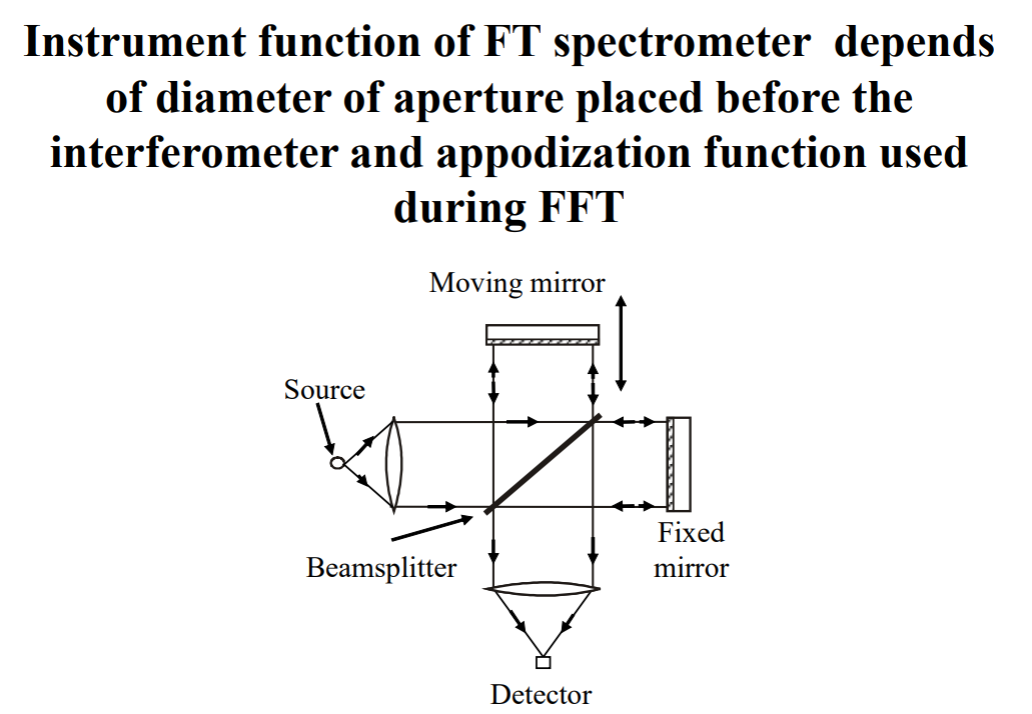
IMPORTANT!!!! Reason for the spectral broadening is instrumental function of the spectral device.
Instrumental Function
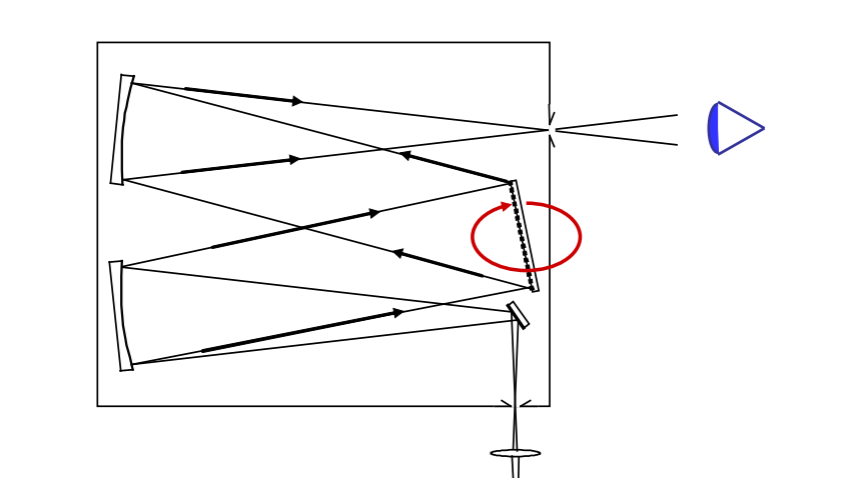
Remember we discussed a monochromator? That it had slits, where rays are focused or crossed and two optical elements with same f-number, focusing and colluminating mirrors... One other element is the diffractor.file://wsl.localhost/Ubuntu/home/selinguler/vu/spectroscopy/notes/02.html you can see here it was a diffraction grating.
Instrumental function is associated with the diffractor. Let's investigate.
 What is instrument function? So even if a source emitted an ideally delta function shape spectral line, a real spectrometer would record a finite-width peak. The measured shape is the instrument function.
 S(ν) is the spectrum of the source, purely formed line shape; and G(ν) is the instrument function. It looks like delta function, also some fourier transform formulas from meth methods but I cannot remember exactly. But that form of integral is very familiar damn.
Different type of instruments (Grating spectrometer, FTIR, Fabry-Perot, etc.) has different functions (Gaussian, sinc or sinc2, Lorentzian, respectively).
 You wonder what this figure illustrates? Same! Welcome to the party!
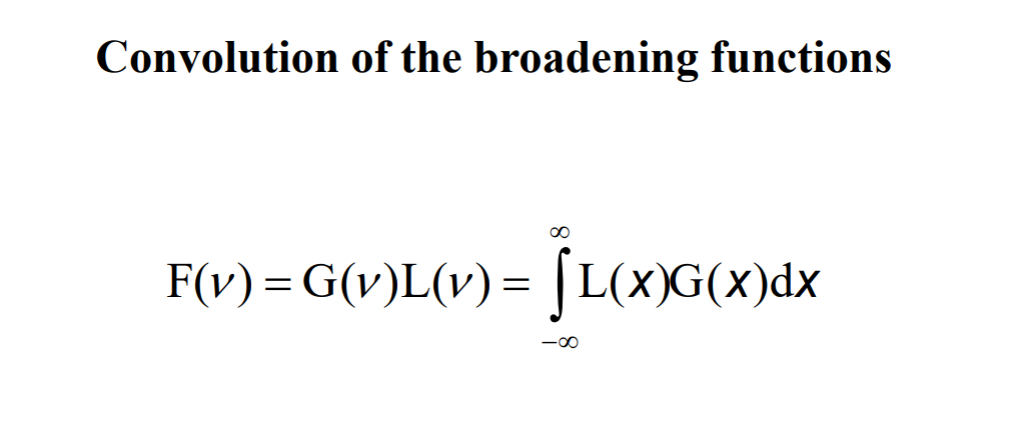
All types of broadening work together. Final contour is convolution of contours caused by a different broadening reasons including instrument function of the spectral instrument.
Convolution is a weird concept. It is defined as a mathematical operation that combines two functions to make up a third one, showing how the shapes of the one is modified by the other.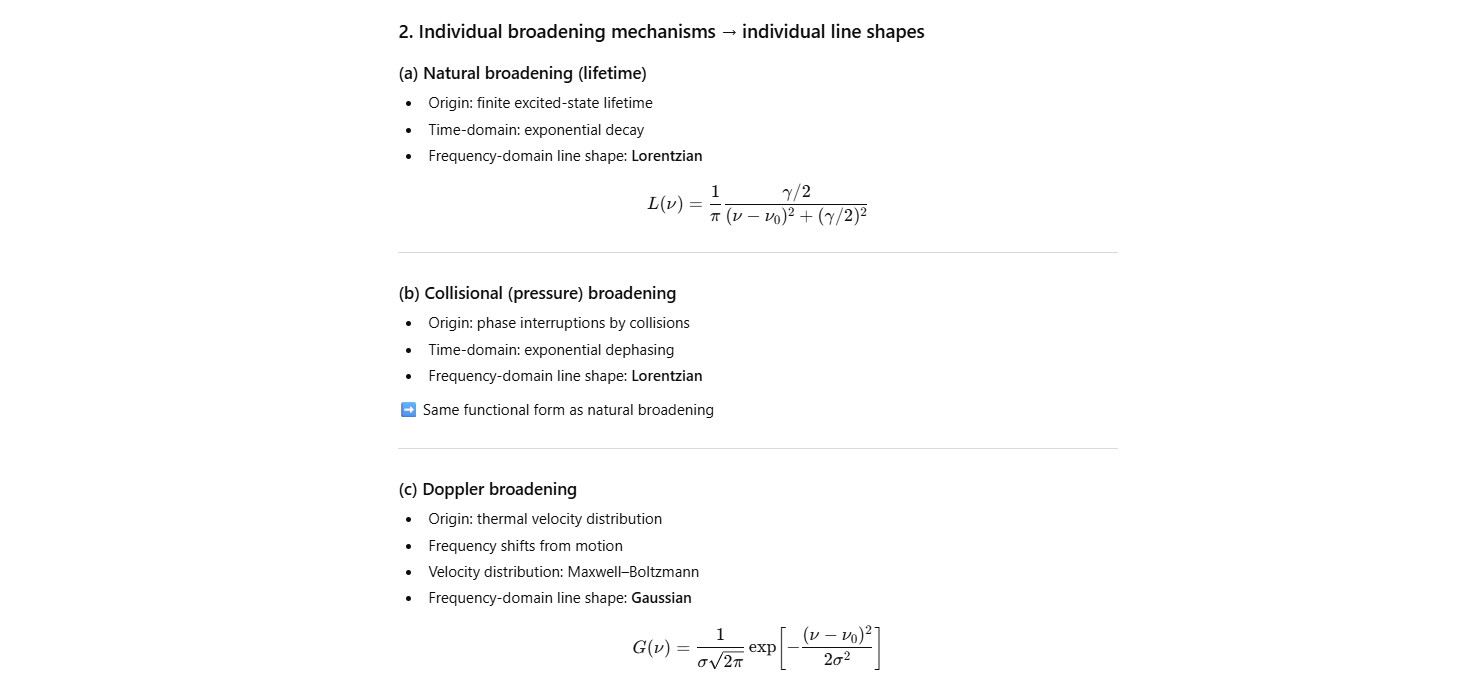 If you remember this integral, it was a convolution:
Here it is also given:
If you remember this integral, it was a convolution:
Here it is also given:
 Take a look:
https://www.spectralcalc.com/info/InstrumentFunctions.htmlhttps://www.astro.utoronto.ca/~rucinski/manscr/Izmir98pub.pdfhttps://www.ta3.sk/IB2E/talks/FT03.pdfContinuing with the main parameters of the spectral lines OR bands, which are,
Spectral lines or bands can be partly overlapped.
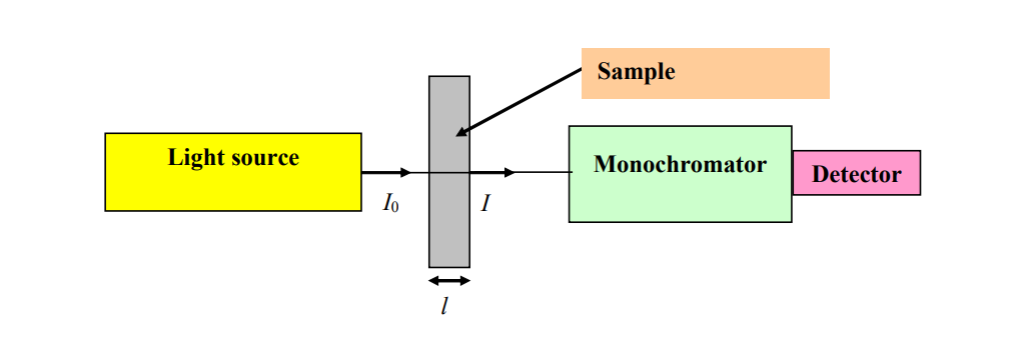 You are looking at a simple absorption experiment. We have a light source, an incident intensity, sample volume or area whatever, an transmitted intensity that is modifed due to absorption which is dependent in
molecular energy levels, concentration, path length; monochromator to collecting light and creating a spectra (i guess) and detecting.
We measure:
You are looking at a simple absorption experiment. We have a light source, an incident intensity, sample volume or area whatever, an transmitted intensity that is modifed due to absorption which is dependent in
molecular energy levels, concentration, path length; monochromator to collecting light and creating a spectra (i guess) and detecting.
We measure:
 That gives the absorption spectrum.
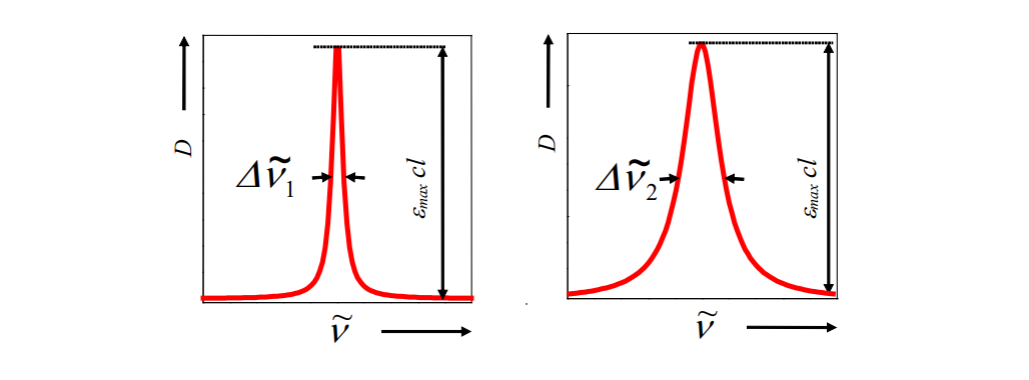 And here we have two absorption spectral bands of different width. What does it refer to you asking? First of all, width doesn't refer to concentration. Big misconception.
In absorption spectroscopy, solutions of integral of a spectral band is directly related to concentration of the substance in the solution.
Regardless (at least directly) the width. Width reflect lifetime, collusions, environment etc. Concentration is determined from: Also you can easily conclude in a condition of same conditions for absorption, if band becomes broder (width decrease) area may remain same, so it indicates they are not refering to same feature. For broader or narrower bands area may be same and it would also have the same concentration.
In summary, what is a spectral line? It corresponds to an electronic transition. Ideally it is a delta function (it would have zero uncertainty in energy then).
Also you can easily conclude in a condition of same conditions for absorption, if band becomes broder (width decrease) area may remain same, so it indicates they are not refering to same feature. For broader or narrower bands area may be same and it would also have the same concentration.
In summary, what is a spectral line? It corresponds to an electronic transition. Ideally it is a delta function (it would have zero uncertainty in energy then).
Spectral lines can have a width (they mostly do). Width corresponds to lifetime of excitation. Why?
Due to uncertainty relations of energy and time. Broader a spectral line, more uncertain the energy is.
 Narrow band → High certainty in energy, short lifetime of excitation.
Broad band → Low certainty in energy, long lifetime
IMPORTANT!!!! Why finite lifetime causes energy uncertainty?
Great great question.
 This is how an state evolves according to QM. It is a time dependent function. μ is the lifetime. If we fourier transform:
 We have an energy function now. This is a Lorentzian shape. Which corresponds to uncertainty of energy for a single transition. That illustrates the energy-time uncertainty relation in this case.
Spectral lines are energy uncertainities of electronic transitions due to finite lifetime of states.
OVERLAPPINGS
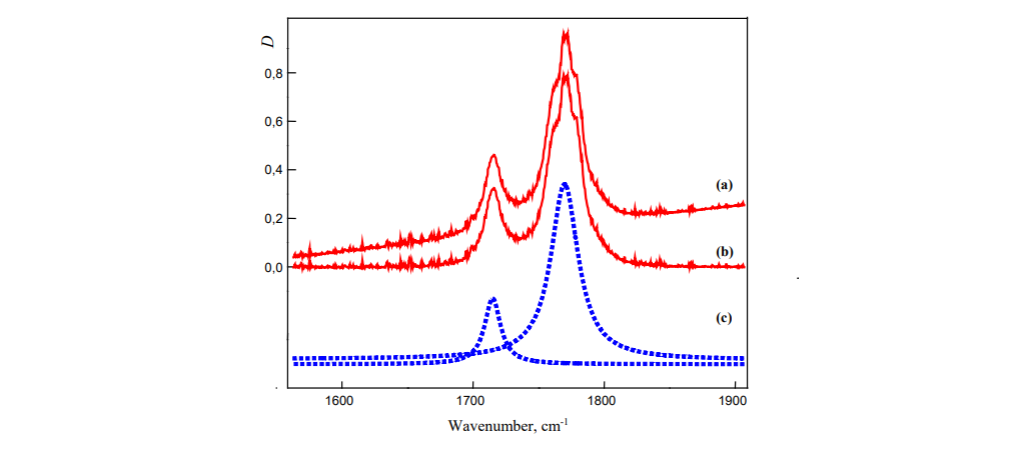
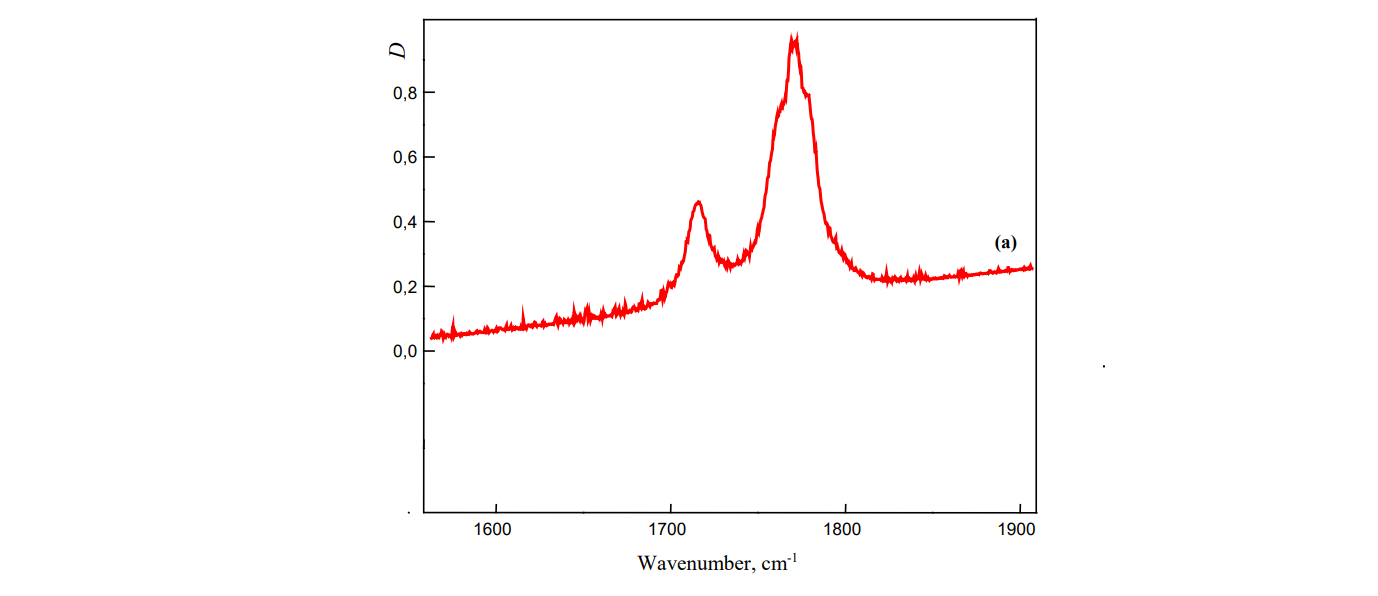 Here you have two overlapping spectral bands (we still don't know what spectral band is btw).
Infrared absorption spectroscopy
Also called Fourier Transform Infrared Spectroscopy (FTIR). It is a type of vibrational spectroscopy. Let's simply review energy levels in a system with the following: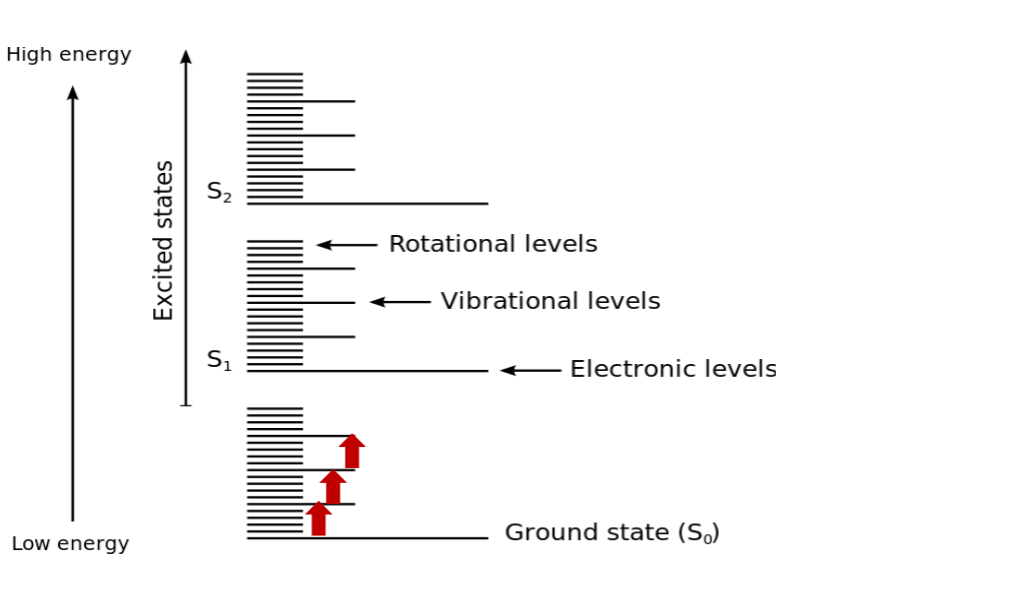 For diatomic molecules we use harmonic oscillator modelling which simple illustrates
 F=-kx and [k] = Nm-1
Solving the harmonic oscillator classically, we only can estimate frequencies of the system. But not particually energy transitions.
Goal is to estimate energy transitions between vibrational levels.
So we also solve quantum mechanically, and as we obtain enery eigenvalues and eigenfunctions, we can analyize quantum harmonic oscillator.
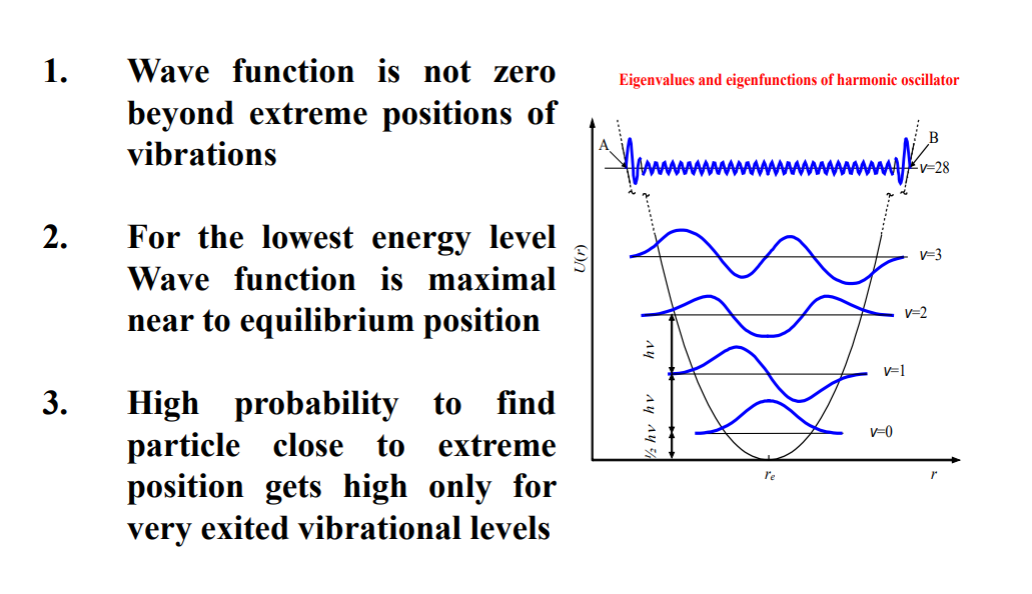
ANALYSIS
There are points that are further extreme points but doesn't make the wavefunction zero. Meaning some classically banned areas particle can still occur.This extreme points occur more as we go to excited states!!! And probability to find them near extreme points are higher.
The ground state has the highest probability of finding the particle near equilibrium.
How does quantum harmonic oscillator tells as about vibrational energy transitions?

 Mathematically, for TISE, En is sharp. Certain. But in reality TDSE leads to lifetimes in states and not stable states. Leading to uncertainities in energy therefore widths in spectral lines.
Also eigenfunctions leads to transition probability:
 Where μ is the dipole moment. Check griffiths if you are interested:

Absorption of infrared radiation
Remember this setup?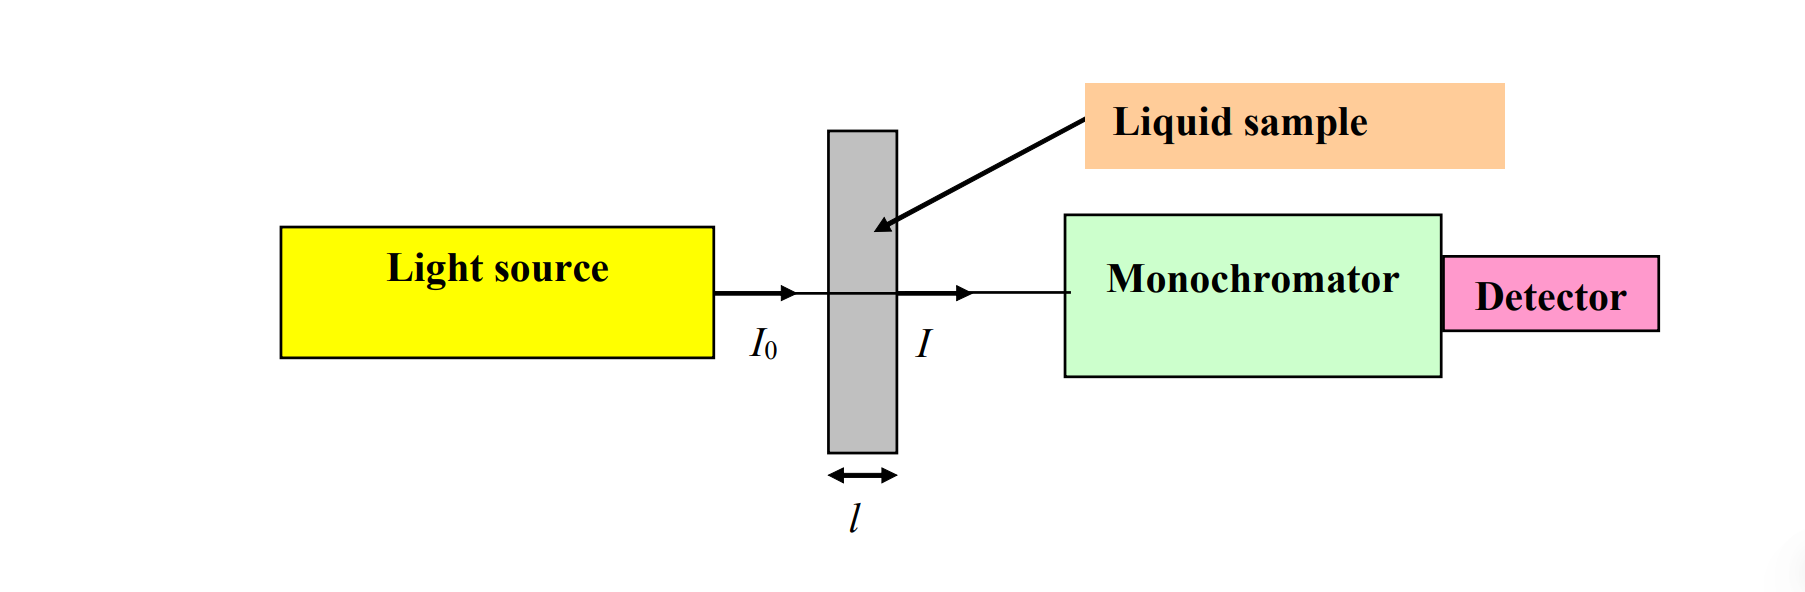 Apperantly experiment reveal that:
 We obtain the Lambert (Lamber-Bouguer) law from here.
We have two types of coefficients: a decimal absorption coeff. and b absorption coeff.
We obtain the Lambert (Lamber-Bouguer) law from here.
We have two types of coefficients: a decimal absorption coeff. and b absorption coeff.